Tuesday, December 30, 2014
S&P 500 Futures...some perspective
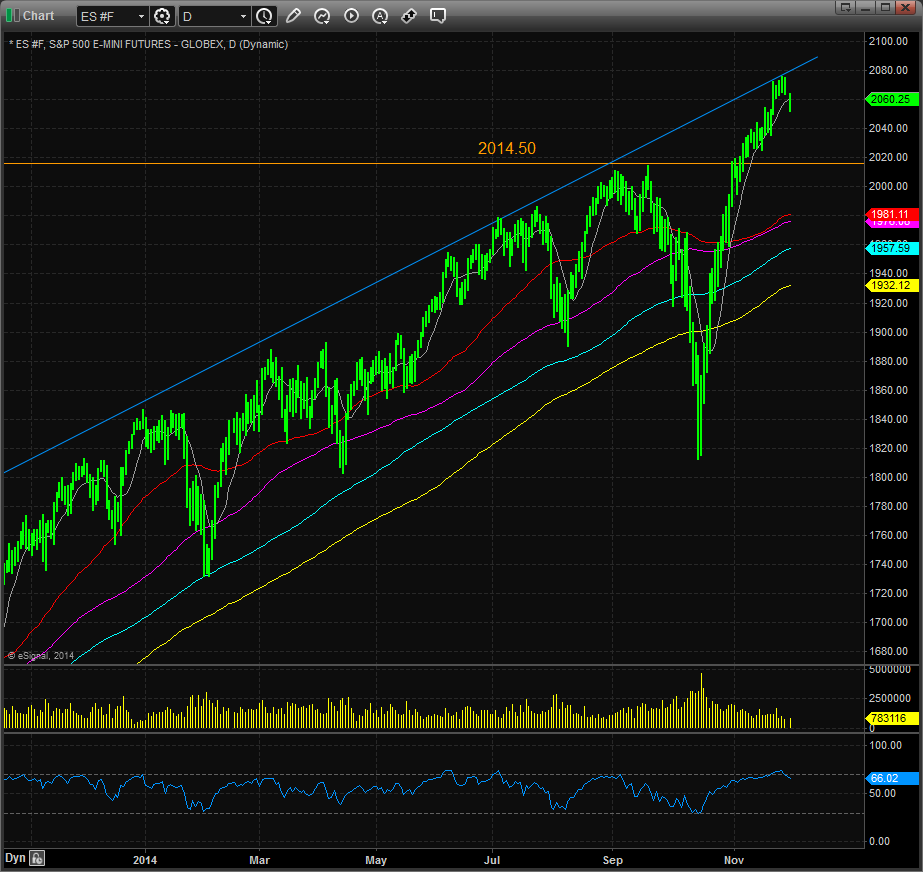
We're up against the upper band again.
2075 is the pivot. If we hold, the year end mark up artists should come in and drive this market higher.
The 9 dma (grey line @ 2068) is additional support.
The 50 dma (red line @ 2028) could be tested if profit protectors panic here.
Monday, December 15, 2014
S&P 500 Futures...some perspective (and the 150 dma support level is back)
Here's the bigger picture with a well defined channel. As the market plays ping pong between the major (9,50,200) moving averages, trade accordingly.
Notice the RSI @ 32.
But the 150 dma (currently right here @ 1970 in the following chart) has been the line in the sand more often than not. The only time it got violated in recent history was the October meltdown.
I would use this level as an opportunity for aggressive traders to get long. The 50 dma above @ 1996 is a decent first target.
Under 1970 with conviction, however, brings the 200 dma @ 1943 into play. After that, the lower band is calling.
Friday, December 12, 2014
S&P 500 Futures Hit First Stop in Correction
After failing at the top end of the range (2075), S&P futures have come back and tested the September highs (2014).
I'd cover some shorts here and wait for higher levels to reload (the 9 dma @ 2052 is resistance) and capture some alpha in the process.
The 50 dma @ 1996 has a big bullseye on it...it's just a matter of time before we test it.
Tuesday, December 9, 2014
S&P 500 Futures Fail Again at Upper Trendline
We failed hard at the 9 dma @ 2064 as well.
The news today in China and Greece is not good, the dollar has sold off, and oil is still getting crushed.
The dip buyers have their work cut out for them today, otherwise the 2014.50 level highlighted here last week looks like a near term target.
The 50 dma @ 1991.74 lingers below.
Monday, December 1, 2014
S&P 500 Futures fail @ 2075. Now What?
Close-up:
As I write this, we're right at the 9 dma @ 2060, which is the number I'm using as the pivot.
The 2075 top call proved correct so far and its going to take a Santa Claus rally to get us through that prohibitive level on the long term chart.
If the dip buyers don't step up soon, the target on the downside is 2014.50 (9/19/2014 highs before the last correction).
Subscribe to:
Comments (Atom)


