Tuesday, December 30, 2014

S&P 500 Futures...some perspective


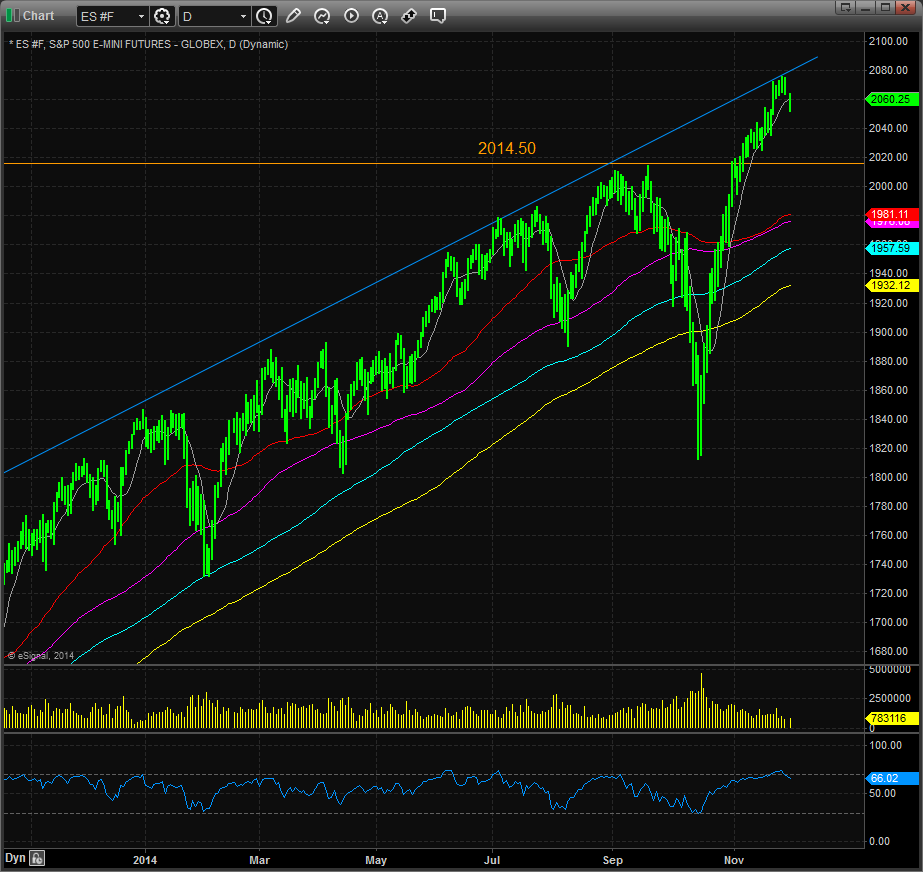
We're up against the upper band again.

2075 is the pivot.  If we hold, the year end mark up artists should come in and drive this market higher.

The 9 dma (grey line @ 2068) is additional support.

The 50 dma (red line @ 2028) could be tested if profit protectors panic here.

Monday, December 15, 2014

S&P 500 Futures...some perspective (and the 150 dma support level is back)


Here's the bigger picture with a well defined channel.  As the market plays ping pong between the major (9,50,200) moving averages, trade accordingly.

Notice the RSI @ 32.

But the 150 dma (currently right here @ 1970 in the following chart) has been the line in the sand more often than not.  The only time it got violated in recent history was the October meltdown.


I would use this level as an opportunity for aggressive traders to get long.  The 50 dma above @ 1996 is a decent first target.

Under 1970 with conviction, however,  brings the 200 dma @ 1943 into play.  After that, the lower band is calling.


Friday, December 12, 2014

S&P 500 Futures Hit First Stop in Correction


After failing at the top end of the range (2075), S&P futures have come back and tested the September highs (2014).

I'd cover some shorts here and wait for higher levels to reload (the 9 dma @ 2052 is resistance) and capture some alpha in the process.

The 50 dma @ 1996 has a big bullseye on it...it's just a matter of time before we test it.

Tuesday, December 9, 2014

S&P 500 Futures Fail Again at Upper Trendline


We failed hard at the 9 dma @ 2064 as well.

The news today in China and Greece is not good, the dollar has sold off, and oil is still getting crushed.

The dip buyers have their work cut out for them today, otherwise the 2014.50 level highlighted here last week  looks like a near term target.

The 50 dma @ 1991.74 lingers below.

Monday, December 1, 2014

S&P 500 Futures fail @ 2075. Now What?


Close-up:


As I write this, we're right at the 9 dma @ 2060, which is the number I'm using as the pivot.

The 2075 top call proved correct so far and its going to take a Santa Claus rally to get us through that prohibitive level on the long term chart.

If the dip buyers don't step up soon, the target on the downside is 2014.50 (9/19/2014 highs before the last correction).

Friday, November 21, 2014

S&P 500 Futures...Getting Close to the 2075 Target / Upper Band


Close-up:


Discipline dictates taking some profits here as we've had this upper band pegged for awhile.

Nimble traders can short and cover at the 9 dma @ 2044.

I would use the Draghi headlines as a selling opportunity.  You can always reload lower and create some alpha in the process.

Thursday, November 20, 2014

S&P 500 Futures...Heads up on Divergence vs. Junk Bonds


The Junk Bond index is yielding over 6%, which has been a deterrent to stocks since 2010.

Weakness in HYG has acted as a leading indicator in the past and the current divergence cannot be ignored.


Tuesday, November 18, 2014

S&P 500 Futures...some (longer term) perspective


The blue trend line in the chart above has been very consistent since the 2009 lows.

The upper band that I wrote about earlier looks to be about another 25 points higher...call it 2075.

As hard as it may be to stay long / buy dips / not get married to shorts, I think thats the call until the charts say otherwise.


Friday, November 14, 2014

FSLR worth a shot on the long side


The HAL / BHI deal probably put a temporary low in the OIH.

$FSLR and other energy derivatives have sold off hard with the recent decline in oil and the energy space.

$45.80 - $46.25 looks like a decent level to get long for a trade.  At least cover shorts there.

RSI shows an oversold condition as well.

Target is the 9 dma (currently $51.77 but declining).

Thursday, November 13, 2014

S&P 500 Futures...support @ the 9 dma = 2024.75 currently


Below the 9 dma @ 2024.75 there's nothing but air until the 50 dma @ 1967.34 and the 100 dma @ 1965.50

I don't see a major catalyst that would cause us to break here, so I'm a  buyer @ 2025  and until we test the upper band of the range @ 2060-2070.

But if we break 2024.75 with authority, I reserve the right to call an audible because the 50 dma @ 1967 comes into play.


Tuesday, November 11, 2014

TWTR...Gap filled...Cover here @ 38.92. Analyst Day Tomorrow


Discipline dictates covering shorts here.  Twitter has filled the gap from 7/29/2014 perfectly.

With an analyst day tomorrow, the animal spirits may be awakened and drive the stock higher in the near term.  No sense taking that potential pain in a squeeze that the promotion may cause.


Wednesday, November 5, 2014

S&P 500 futures...Upper Band Now In Play


Pain Trade to 2060 is in the realm of possibilities.

I'll leave the fundamental explanation to the CFA's and story tellers, but there are still plenty of non-believers and bears that haven't capitulated and could lead us higher as we plow through this untouched snow.

Don't forget that the market is controlled by the 2/20 crowd and there is plenty of money to be made on the 20% of profits into year end.

Wednesday, October 29, 2014

S&P 500 futures...possible head and shoulders forming @ 1985.75


We're above all the moving averages and I can't recall being this far away from the 9 dma (1941.50) in quite some time.

Most bears probably covered after we closed above the 50 dma @ 1962.

I'm sure there are still a lot of shorts that are disappointed the world didn't end last week and that's why we always overshoot in the short term.

But if you're a trader and got long in the 1800's, I'd use this 1985 - 1990 level as a place to lighten up.

I'd even lay out some shorts @ 1985 (right shoulder) and take advantage of the greedy bulls that are calling for 2000.

The 50 dma @ 1962 and the 9 dma @ 1941 beckon.

Tuesday, October 21, 2014

S&P 500 futures...follow up


It didn't take long to get to the 150 dma @1926.80.

The old trendline that provided support should act as resistance here.  Making some sales.


S&P 500 futures...some perspective


Perfect bounces off those trend lines as SkyNet is firmly in control.

We closed right on the 200 dma @ 1901 last night before AAPL's earnings announcement...amazing how often technical and fundamental worlds collide.

Next stop looks like the 150 dma @ 1926.80, which coincides with a major trendline (support has become resistance).   

Thursday, October 16, 2014

Trendline needs to hold


We're right on it this morning after testing and bouncing yesterday to close unched for the year.

Managing risk, I went back to the 2009 lows and connected the dots.

The new trend line coincides perfectly with the October, 2007 peak.

Not a prediction, and this move could take some time, but if the selling intensifies, I'd rather be prepared.

Also, bear markets are defined by a 20% move off the highs.

2000 * .8 = 1600...which is right on the new trend line.

Wednesday, October 15, 2014

S&P 500 futures at trendline support


Saturday's blog pointed out this trendline and at the time, I thought it was a stretch.  Now its coming to fruition.

Gotta buy em here on support.  Relief rally to the 200 dma @ 1900 makes sense.


S&P 500 futures nearing unched for the year


1846.25 is where we closed on 12/31/2013 and is a decent level of support on the chart.  Probably makes sense to cover shorts in here but wait to get long.

Sentiment has deteriorated enough for us to get a bounce back to the 200 dma @ 1900.

Saturday, October 11, 2014

S&P 500 futures...another look


Recently, everyone has been breaking out their crayons to make trendlines.

But every trendline I've seen ignores, as an anomaly, the October 2011 and November 2012 moves.

The chart above shows a trend line drawn that includes those points....since we just broke below the 200 dma @ 1900 and things could get ugly.

Friday, October 10, 2014

S&P 500 futures...some perspective


200 dma = 1900.  Nice round number for all the programs to take us to on a Friday.

Resistance above @ the 150 dma and trend line:  1925.92

Wednesday, October 8, 2014

S&P 500 futures close right on 150 dma


I pointed out the 150 dma @ 1925 yesterday and we closed right on it.  Everyone's a technician when the market sells off and traders turn into market psychologists.

The easiest way to judge sentiment is to reference the charts.  Like a pilot flying blind in a storm, he relies on his instruments to guide him.  

During times of volatile, trendless tapes, the algos and the programs tend to play ping pong with the market in between these levels (9, 50, 100, 150, and 200 dma).

Earnings season starts tonight and will give us a clearer picture.

Tuesday, October 7, 2014

S&P 500 futures...some perspective


We failed this morning @ 1956, which happens to be both the 9 dma and the 100 dma.

Unless we can get above that 1956 level with a little volume and confidence, it looks like lower levels are in store.

1924.95 is the 150 dma and is sitting right on the long term trend line.

The 200 dma @ 1898 is begging for attention as well.

Friday, October 3, 2014

S&P 500 futures...some perspective


Perfect bounce off the trend line yesterday.  Now what?
A rally then roll over would hurt the most people, so that's what I'm leaning towards because the market is a nasty beast.

100 dma = 1954
9 dma = 1961
50 dma = 1969

These are all good levels to lighten up or even lay out shorts, in my opinion.

The 200 dma = 1897 and lurks below with a big bullseye on its head.

Tuesday, April 22, 2014

COMP: Head and Shoulders if we fail at the 50 dma

This is 1 scenario that could play out.  If we get to the 50 dma @ 4224 and fail, that would be the right shoulder coinciding with the left shoulder that happened on 1/22/2014.  

If it happens at the end of this week, the "sell in May" crowd is going to be especially loud and this bearish pattern would help their argument.


Here's How Rich You'd Be If You Did The 'Sell In May And Go Away' Trade Since 1950


Walter Zimmerman, the top technical analyst at United-ICAP, charted the performance of a $10,000 investment in 1950 if you sold in May, and then bought back on November 1.
"The other half of the proverb is ‘Buy Back on Saint Crispin’s Day,’" said Zimmerman.  "That would be 25th October."
"This advice has shined the brightest in those years with the most extreme bullish sentiment going into May."
Check it out:

sell in may
United-ICAP