Tuesday, December 15, 2015

S & P 500 Futures..some perspective and the January Effect


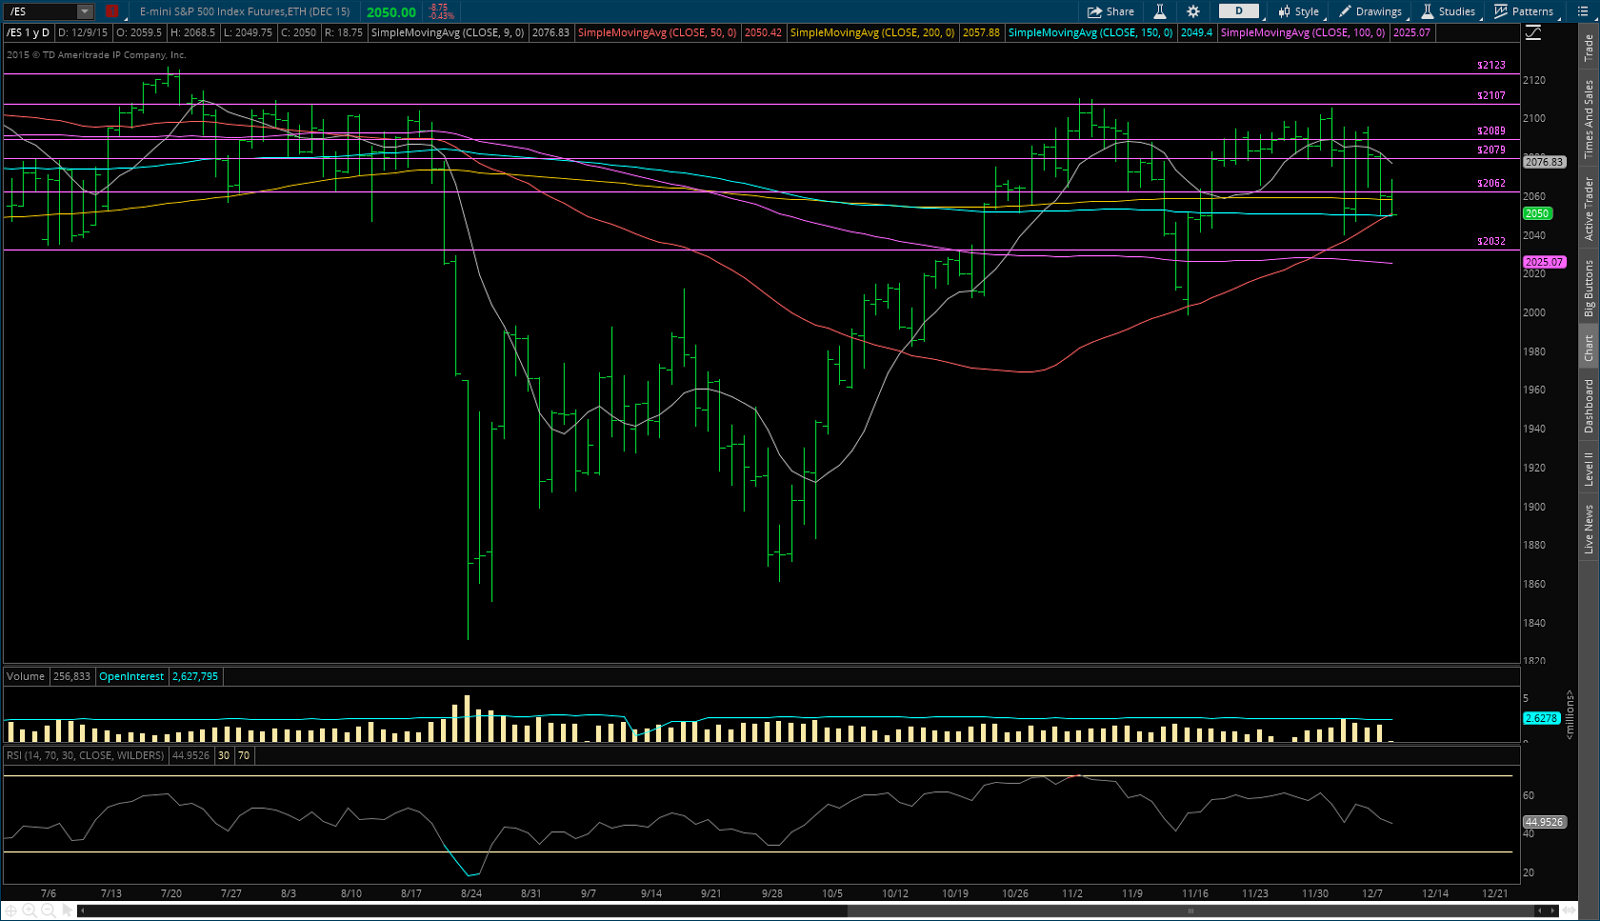
Futures have bounced 50 handles off yesterday's lows and have rallied into a big level right here...2032.

This is probably a decent place to sell some longs and wait for a little bit of a pullback.  You can always reload, however, if we do hold this 2032 level.

I'm waiting for the "January Effect" to start kicking in, so keep an eye out on small caps (IWM) for relative strength.

2012 is still big underneath and would provide a better entry point, but there's no need to get too cute.

If we can hold 2032, then the 9 dma @ 2046.78 and the 150 dma @ 2047.13 come into play quickly as greed will trump fear.

Remember, its year end and bonuses are on the line.

Friday, December 11, 2015

S&P 500 Futures are heavy this morning and below most support levels


Futures are below most support levels and are currently trading around the 100 dma @ 2023.94.

Below the 100 dma, there is some noise on the charts around 2012.

2 causes for weakness this morning:

1. Crude oil continues to get rocked due to oversupply issues and is hitting a multi year low as we speak.

2. The reality of the Fed meeting next week.  Often a leading indicator of equities, the junk bond market (JNK) is hitting multi year lows.

$34.09 is the low from 2010:


Playing for the bounce at support levels after sharp sell off's has been working recently, as we caught a nice trade Wednesday and sold at the top.

I would prefer an entry point of 2012-2014, but JNK and /cl (crude oil) are my tells this morning.

If JNK can hold that $34.09 level and crude stops bleeding, futures could snap back to 2032.

Through 2032 with some confidence and volume gets us to the 150 dma @ 2048.57.

Wednesday, December 9, 2015

S & P 500 Futures right @ 50 dma support (2050.42)


Futures retesting support here this morning @ the 50 dma (red line above).  The 150 dma (light blue line) sits right below @ 2049.40.

This is the spot to buy them for a trade if you missed yesterday's test.

Again, this is not a marriage...catch and release.

2062 is the pivot and has been a battlefield.

If we break through 2062 with a little confidence and volume, look to make sales @ 2079.

The market has been trading with crude lately and oil is up this morning.

Just to keep everyone honest, crude could rally and test its 9 dma @ $40.01, which should give a bid to the overall market and get some shorts to cover that have overstayed their welcome:


Tuesday, December 8, 2015

S & P 500 Futures...nice bounce at support...2062 pivot


200 dma = 2058.17; 150 dma = 2049.74; 50 dma = 2047.55.  In other words, lots of support here.

Crude seems to have stabilized and it looks like it wants to go green, now that everyone is convinced it's going to $30.  That could really help the market, especially since it's right above all these support levels.

Remember, shorts need to take profits, too.

Among the market ETF's, QQQ still has the relative strength, but IWM has a lot of oil names in it.  

If crude does go positive and we stay > /es 2062, IWM (TNA = 3x) could rip higher.

But we have to be nimble...everything is a trade here.  I would use /es 2079 as a level to lighten up.


Tuesday, November 24, 2015

S & P 500 Futures to test support this morning


S & P 500 Futures are down 14 after reacting to Nato member Turkey shooting down a Russian warplane near the Syrian border.

As we all know, traders hate the unknown.  And as we've seen many times before, these geopolitical events cause an increase in market volatility as the story plays out and new information is deciphered and analyzed.

However, the good news is that we've also seen technical levels provide clarity during these times of unknown fundamentals.

Like a pilot uses his instruments to fly through the fog, use the charts this morning to trade these events.

3 important levels are bunched up and sit right below us:

2062 has been a huge level since Spring.
2061.47 (grey line) is the 9 dma.
2059 (yellow line) is the 200 dma.

If the market continues to sell off at the open over geopolitical fears, 2062 is a great place to get long for a trade back to the important 2079 level.

Thursday, November 19, 2015

S & P 500 Futures...some perspective


The Federal Reserve's decision on a December rate hike, corporate earnings, high profile ipo's and geopolitical concerns have been grabbing the headlines and controlling the dialog, yet the market is still bouncing in between well defined support and resistance levels.

For example, even as the terrorists attacks in Paris were causing chaos and fear, the market behaved rationally and bounced right off its 50 day moving average (red line above).

It has since rallied into some resistance at the 2089 level and is currently settling into a battle here at the very important 2079 level.

Of all the factors that may affect the market, I expect year-end performance anxiety from institutional money managers to trump them all.

In other words, buyers are higher and sellers are lower, which should create a great environment for range traders.

Rather than getting overly bullish or bearish, I'm using the levels in the chart above as inflection points to trade against.

Thursday, July 9, 2015

S & P 500 Futures...some perspective

Wild week, but the levels are all still intact.

The March low @ 2032 has held nicely for now and has become the line in the sand.

There's resistance to bounces @ 2062, the 150 dma @ 2073 and 2079.


Greece, Puerto Rico, China, and the NYSE trading halt (hack).

I'm not sure what else they can throw at this market, but be prepared.

If there is another event that causes more selling, keep an eye on 2032.

Under 2032, the red trend line that I highlighted back in October 2014 is back in play and gets us to 2000 quickly:


Tuesday, June 16, 2015

S & P 500 Futures rally into resistance


2089 should present a test to this bounce in the form of resistance, especially with the 9 dma right above @ 2090.42.

Nimble longs who got in @ 2062  would be smart to lighten up here.  You can always reload lower and capture some alpha in the process.

Fast money traders could play for an afternoon roll here @ 2089 but the 50 dma above @ 2101 would be a better spot to put on some shorts.

S & P 500 Futures re-test 2062


Nice bounce so far off the 2062 level overnight.

The 150 dma @ 2071.04 is the pivot.

2079 resistance was the high yesterday and still matters.  2089 is the next target if we get through on volume and confidence (and not just a Greece rumor).

There are a lot of lines of resistance above for this market, so don't expect a straight shot higher.  There's just too much wood to chop.

2062 is support, but triple bottoms are a rare thing.  Heads up if we break as the 200 dma @ 2044.78 would be next.

Monday, June 15, 2015

S & P 500 Futures areas of support


The 2062 - 2065 (I know, 3 point range...its not well defined as you can see in the above chart) area seems to have enough noise to slow down a sell off and perhaps generate a bounce.

Shorts have to cover here.  And nimble longs can get involved.

The 150 dma @ 2070.74 matters above.  If we can get above that level with some volume and confidence, 2079 and 2089 beckon.


S & P 500 Futures approaching important 150 dma


Nothing like a loud wake-up call first thing on a Monday morning.

This chart goes back to December, 2013 and shows the importance of the 150 day moving average.

The 150 dma (currently @ 2070.79) has been a rock for 3 years, but just in case it isn't this time, I think its time to play a little defense.

The failure of this line last October led to a nasty, sharp sell off (and subsequent recovery).

Traders who kept some powder dry and and bought at the well defined trend lines picked up some major alpha at year end.

If we break this line, traders will have some work to do to navigate this tape.  Stay tuned.


Wednesday, June 10, 2015

S & P 500 Futures have rallied right into some resistance


With the downward sloping 9 dma crossing the 50 dma @ 2098.58 we should see some pullback here.

If you bought the bounce at the 150 dma and held through 2079 and 2089, this is where you have to take some money off the table.

Nimble traders can even short here for a re-test of 2089 and perhaps even 2079 if fear comes back into the market due to the bond action (TLT).

Tuesday, June 9, 2015

S & P Futures test 150 dma overnight


The 150 dma (light blue line) is currently 2068.98, which we tested and held essentially to the tick...the overnight low is 2068.75.

2079 should be a battleground as the bounce continues, but if we can get above that 2079 with a little confidence and volume, 2089 is next.

Besides the 150 dma @ 2068.98, 2062 is additional support if the sellers emerge at the open.

Monday, June 8, 2015

S & P 500 Futures Approaching 2 big levels.


After challenging and holding Friday, the 100 dma @ 2081.86 is again near.  It makes sense to keep some powder dry until we test it.

With the important 2079 level right below, we have 2 solid levels to use as support.  The market has bounced from these points consistently.

Patience.

Thursday, February 12, 2015

S & P 500 Futures at Important Level...2079


The overnight reaction to the geopolitical news  has been positive so far.  The s & p 500 futures have traded as high as 2079, which coincides with the December peak (left shoulder for the bearish technicians).

After holding support at the 200 dma, the market has rallied past that 2062 battleground.

As we've seen time and time again the news flow, and more importantly the market reaction to it, can change on a dime.

2079 is a good level to lighten up on longs that were bought with bids from the 200 dma levels.  Why get greedy in the face of potential headlines risks?

Nimble traders can short here and cover at the 9 dma (gray line @ 2049).


Wednesday, January 28, 2015

S&P 500 Futures close right on the 150 dma


This 150 dma level has been a huge level of support for the market over the last 3 years. Unfortunately for the bulls, the head and shoulders pattern I warned about last week has taken shape.

If  / when we fail here, the next level of support is the 200 dma (yellow line @ 1968).

Earnings season always guarantees some volatility and we're right smack dab in the middle of it.  AAPL and Boeing both had great earnings reports and the market still gave up all its gains and went negative on the FOMC's comments.

Friday, January 23, 2015

S & P 500 Futures...some perspective


After holding the 200 dma (yellow line @ 1966) and December's low (1961.50), the market has bounced back to levels where we may want to start trimming some long exposure.

We survived the bank numbers, but earnings are starting to pour in and volatility is guaranteed.

2 levels to trade around:

2062 was the high from January 9th.  I expect the machines to do some selling there, but support lies at the 50 dma (red line @ 2042.65).

2079, from December 5th of last year, represents the peak of the left shoulder of this still forming pattern.  A fail there sets up a classic head and shoulders.


Thursday, January 15, 2015

Volatility could be a sign of an inflection point

Whenever futures trade up and down 40 points in air pockets on little or no news, something is brewing under the surface.  It's the kind of action that happens at inflection points.

There has also been a series of lower highs (red trend line) on the  S & P Futures.  The 150 dma (pink line @ 1986) looks like its poised to be tested yet again:


The 150 dma has been a great buying opportunity for trades, but each time a level of support is tested, it gets weaker.

I'm not sure how many times we can go to the bank on this level.  I wouldn't bet on it holding next time, so I'm using the 200 dma (yellow line @ 1961) as my next target.

That level also coincides with December's low, a number that a lot of traders are targeting.

Tuesday, January 13, 2015

Outside day today...lower levels on their way.

From Investopedia:

DEFINITION OF 'OUTSIDE REVERSAL'

A price chart pattern in which a security's high and low prices for the day exceed those of the previous trading session. The outside reversal pattern is called by candlestick chartists and analysts a "bearish engulfing" pattern if the second bar is a down candlestick, and a "bullish engulfing" pattern if the second bar is an up candlestick.

INVESTOPEDIA EXPLAINS 'OUTSIDE REVERSAL'

An outside reversal is a price pattern used by technical analysts to help identify potential bearish or bullish price movement in a particular market. It occurs where a price bar falls "outside" of the previous price bar, where its high is greater than the previous bar's high and where its low is lower than the previous bar's low. In general, if the outside reversal occurs at a resistance level, it is viewed as a bearish signal; if it occurs at the support level, it is viewed as a bullish signal.


I would expect support at the 150 dma (pink line @ 1985) to be tested soon.
The 200 dma (yellow line @ 1959) is additional support.
Resistance lies above at the 9 dma (grey line @ 2029) and the 50 dma (red line @ 2042).
Bank stocks are reporting and judging by my friend Dave Nelson's preview, the fundamentals aren't going to be able to compensate for the technical risk this market faces.

Tuesday, January 6, 2015

S&P 500 Futures bouncing off the 150 dma @ 1983.


We highlighted the 150 dma Friday as a level of support.  Well, we're there.  Today's low of the day = 1984.25 (pink line above in chart).  The RSI got to an oversold level of 35 as well.

Nothing has really changed from a news flow standpoint.  There have been no external catalysts besides tax selling and the oil disruption.  In other words, no new "uncertainties".

So we buy 'em here.  If by chance we pierce the 150 dma, the algos should kick in and initiate their buy programs and close us above that level.

2012 seems like a decent first target.

The 50 dma is resistance @ 2036 (red line).

The 200 dma is further support @ 1955 (yellow).


Friday, January 2, 2015

S&P 500 Futures approaching temporary support @ the 50 dma (2034)


After failing at the top end of a well defined range, futures have slipped and are close to testing support at the 50 dma @ 2034 (red line above).  I'd use a pause / bounce there to add to shorts and lighten up on longs.

A lot of people have been waiting for the clock to turn to 2015 to take profits and delay paying the tax man, so we're probably not going to be done with this pull back in the near future.

I'd like to see the RSI touch the yellow line in the bottom of the graph (30 level) before thinking about longs.  A move to the all important 150 dma @ 1981 (pink line) would get us there.